
Pick a per-person benchmark, size it to peak in-office attendance rather than total headcount, add communal areas and a load factor, then test-fit the result on a real floor plate. For most mixed offices, that lands somewhere between 9 and 14 square metres of usable space per person. Anything more precise than that needs your own numbers, not a generic rule.
TL;DR:
- Most mixed offices require between 9 and 14 square meters of usable space per person, depending on density band and communal area allowances.
- Accurate peak occupancy data, ideally collected via sensors over four weeks, is critical for precise space planning and avoiding overspending or overcrowding.
- Role-based allocations and hybrid attendance patterns significantly affect space requirements, with private offices needing 12 to 20 square meters per person and open workstations 4 to 6 square meters.
- Compliance constraints such as egress, ventilation, amenities, and occupant load can set hard limits on layout, requiring early consultation with architects and certifiers.
- Implementing a detailed test-fit and incorporating growth buffers into the final lease ensures the design remains practical and adaptable for staff growth.
Table of Contents
- What are the current office space standards for planning?
- How do you calculate office space requirements?
- Role-based allocation and hybrid occupancy patterns
- What compliance checks affect your office layout?
- How much space should each area type get?
- Turning the numbers into a fit-out: an implementation checklist
- How Niche Projects applies this planning method
- Sources
What are the current office space standards for planning?
There’s no single legislated figure for square metres per person in most jurisdictions, but there’s broad market agreement on sensible bands depending on how a workplace actually operates. The most commonly cited planning anchor for 2025 to 2026 mixed-use offices sits around 100 to 150 square feet, roughly 9 to 14 square metres per person, and that’s a fair place to start a conversation with an architect or landlord.
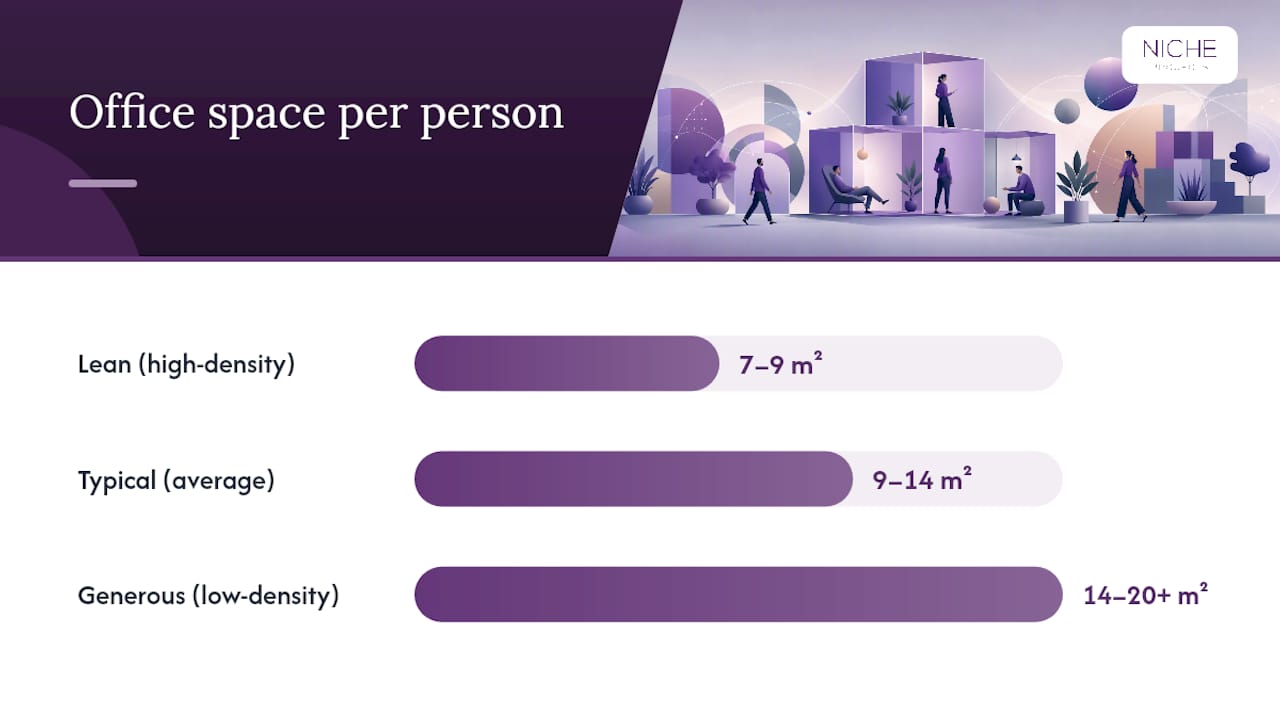
Three density bands cover most workplace types:
- Lean or high-density (7–9 m² per person): Common in agile tech firms, contact centres and startups running hot-desking with low storage needs. It works when the culture already favours activity-based movement over fixed seats, but it punishes any organisation that still clings to assigned desks and filing cabinets.
- Typical or average (9–14 m² per person): The default for mixed corporate offices with a blend of open workstations, meeting rooms and some private offices. Most professional services firms, agencies and mid-size corporates land here.
- Generous or low-density (14–20+ m² per person): Legal practices, executive suites, and organisations where private offices and formal meeting culture dominate. Higher cost per head, but often justified by client-facing requirements or confidentiality needs.
Communal area allowances shift these numbers further. A workplace with generous breakout zones, wellness rooms and social kitchens can add 20 to 30 percent on top of raw workstation area, which is why two offices with identical desk counts can have wildly different total footprints.
It’s worth noting why these figures have fallen since 2010. A decade ago, 20 to 25 square metres per person wasn’t unusual in Australian corporate offices, driven by larger individual workstations, more private offices and less shared infrastructure. The combination of hot-desking, activity-based working and post-pandemic hybrid attendance patterns has compressed that considerably. Fewer people in the building on any given day, plus a cultural shift toward shared and bookable space, means the same headcount now needs a noticeably smaller floor plate, provided the space is designed well rather than just squeezed.
How do you calculate office space requirements?
The maths isn’t complicated, but skipping a step is how organisations end up either overpaying for empty desks or crushing staff into a floor plate that never worked on paper.
Inputs you need before you start:
- Total roster headcount, including part-time and casual staff
- Remote or hybrid staff numbers and their typical in-office days
- Peak occupancy percentage (the busiest realistic day, not the average)
- Desk-to-person ratio you intend to run (1:1, 1:1.5, 1:2, etc.)
- Your chosen per-person usable benchmark from the bands above
Step 1: Compute required desks from peak occupancy. Multiply your roster by the peak attendance percentage, then apply your desk-sharing ratio. A team of 100 with 70 percent peak attendance and a 1:1.4 sharing ratio needs roughly 50 desks (100 × 0.70 ÷ 1.4).
Step 2: Multiply desks by your benchmark. If you’ve settled on 11 square metres per person as a typical mixed-office figure, 50 desks needs 550 square metres of usable workstation area.
Step 3: Add communal areas and apply the load factor. Communal space (meeting rooms, kitchens, breakout areas) typically adds another 20 to 30 percent. Then a load factor of roughly 1.15 to 1.25 converts usable area into rentable area, covering shared building elements like lobbies, lift cores and corridors outside your tenancy.
Step 4: Add a growth buffer and round to a sensible lease size. Most planners build in 10 to 20 percent for headcount growth over the lease term, then round to whatever floor plate increments a landlord can actually offer.
Here’s how that plays out for a 25-person team:
That 25-person team lands close to 284 square metres of rentable space, roughly 11.4 square metres per rostered head once every multiplier is in, even though the raw per-desk figure looked like 11. Circulation and loss factors deserve to be tracked as their own line items rather than folded into a single rounded percentage. Treating them separately is what stops budgets blowing out mid-fit-out when a landlord’s actual measured loss factor turns out higher than assumed.
Role-based allocation and hybrid occupancy patterns
Flat per-person figures are a decent starting anchor, but they fall apart the moment you have a genuine mix of roles and hybrid attendance. Role-based allocation, sizing space to what each function actually does, is now standard practice among workplace strategists, and it produces more defensible numbers when finance asks why the fit-out costs what it does.
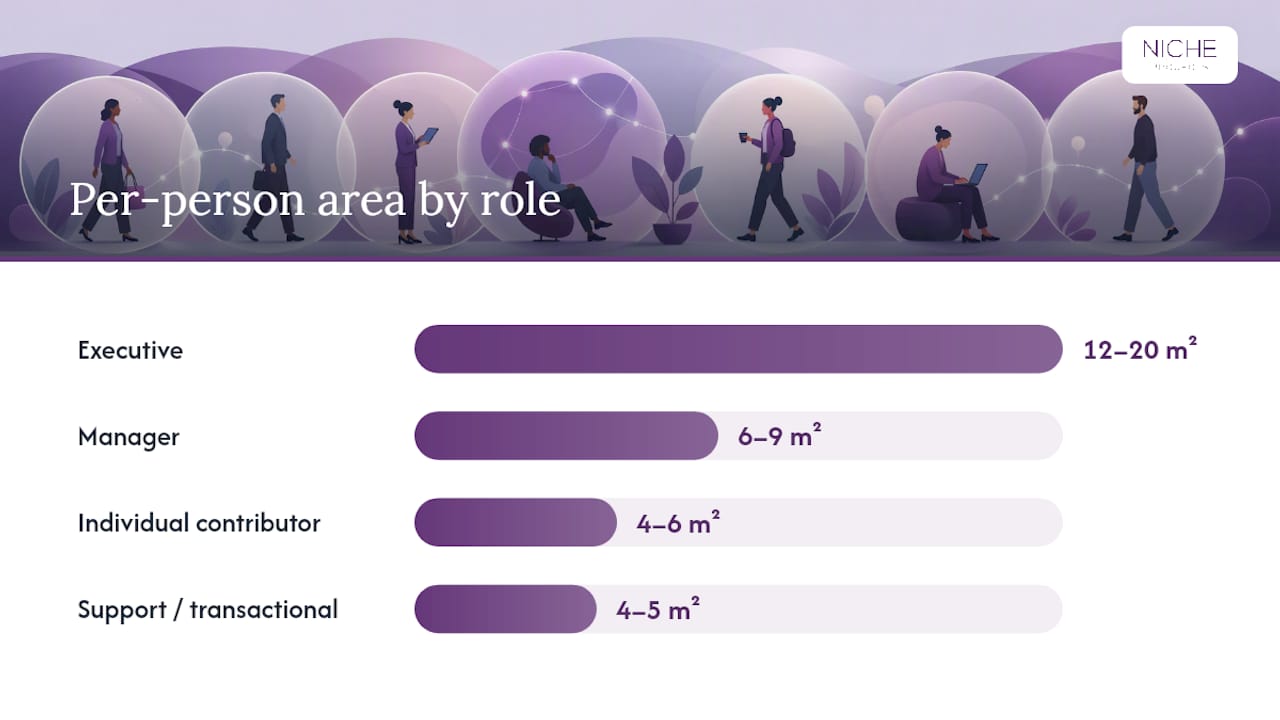
Rough per-person ranges by role:
- Executive (private office): 12 to 20 m², often including a small meeting table
- Manager (semi-enclosed or larger workstation): 6 to 9 m²
- Individual contributor (open workstation): 4 to 6 m²
- Support/transactional roles: 4 to 5 m², typically clustered near shared equipment
Desk-sharing ratios then layer on top of those role figures. A 1:1 ratio suits roles requiring dedicated storage or fixed equipment, like finance or legal teams handling sensitive documents. A 1:1.5 ratio works for teams with moderate hybrid attendance, say three days a week average. A 1:2 ratio suits fully flexible, high-hybrid teams like sales or consulting staff who are rarely at the same desk twice.
Getting the peak occupancy number right matters more than almost any other input, because it drives every downstream calculation. Sensor-based occupancy data tends to give the most reliable read on actual dwell time and peak attendance, while badge swipes and room bookings both have blind spots. A badge swipe tells you someone entered the building, not whether they used a desk for six hours or fifteen minutes before heading to a client site.
Pro Tip: Run your occupancy data collection for at least four full weeks, including a school-holiday period if you can, before locking in a peak-day figure. Single-week snapshots routinely understate true peak attendance by 10 to 15 percent.
Hybrid patterns also reshape meeting room demand. Fewer fixed desks per person usually means more bookable collaboration space is needed, because hybrid teams lean harder on scheduled meetings to replace the informal conversations that happen naturally in a fully staffed office. Running inclusive hybrid meetings that work equally well for remote and in-room participants becomes a layout decision as much as a technology one, particularly around camera placement and acoustic treatment in mid-sized meeting rooms.
What compliance checks affect your office layout?
There’s no single statutory square-metre-per-person figure that applies uniformly, but that doesn’t mean there’s no regulatory floor. Several documents set real constraints on how you can shape a layout, and skipping them is one of the most expensive mistakes in office planning.
Government fit-out guidance, such as the Part 3: Workplace Design standard, sets density benchmarks and design expectations that many organisations use as a reference point even outside their original jurisdiction. Health and safety compliance codes, including WorkSafe Victoria’s guidance on workplace facilities and the working environment, cover the practical requirements: ventilation rates, facility ratios, and the working environment conditions that determine minimum viable space regardless of your preferred density.
Before committing to a layout, work through this checklist:
- Egress and accessibility: Confirm corridor widths, door clearances and accessible path-of-travel requirements with your building certifier; these constrain usable area far more than most planners expect.
- Ventilation and fresh air rates: Higher-density layouts increase mechanical ventilation load, which can force HVAC upgrades that eat into your fit-out budget.
- Amenity ratios: Toilet, kitchen and shower facility requirements typically scale with headcount, not floor area, so a denser layout can trigger facility upgrades you hadn’t budgeted for.
- Fire safety and occupant load: Building codes cap maximum occupant numbers per floor area for evacuation purposes; this is the closest thing to a hard statutory ceiling most offices will hit.
Consult your architect and building certifier early, and treat WorkSafe guidance as a design input rather than a box to tick after the fact. A layout that looks efficient on paper can still fail a certifier’s review if egress widths or amenity ratios weren’t checked against actual headcount.
How much space should each area type get?
Once you know your rough headcount and density band, the next question is how to slice that area across workstations, meeting rooms and support spaces. Published planning guides give sensible starting ranges for each:
| Space type | Typical area range | Notes |
|---|---|---|
| Open workstation | 4–6 m² per person | Includes immediate circulation |
| Private office | 12–20 m² | Varies by seniority and furniture |
| Small meeting room (4–6 people) | 9–14 m² | Roughly 100–150 sq ft |
| Large/conference room | 14–20+ m² | Roughly 150–215 sq ft |
| Phone booth/focus room | 2–4 m² | One or two person capacity |
| Reception | 15–30 m² | Scales with visitor volume |
| Kitchen/breakout | 20–30 percent | Scales with headcount and culture |
General rules of thumb worth carrying into any early layout:
- Communal space typically runs 20 to 30 percent of total usable area in a well-balanced office.
- Circulation adds a notable amount on top of workstation area, before you even get to the building’s load factor.
- Technical spaces (server rooms, comms cupboards, plant access) don’t scale linearly with headcount; budget a fixed allowance regardless of whether you’re planning for 30 people or 130.
Two example splits show how fast the percentages move a real number. A lean open-plan office for 50 people might run 60 percent workstations, 25 percent communal, 15 percent circulation on top, landing around 350 to 400 square metres usable. A mixed private-office plan for the same headcount, with a higher proportion of enclosed offices and larger meeting rooms, can push past 550 square metres for the same 50 people, driven almost entirely by the private office allocation and larger conference room requirements. Neither is wrong; they’re two different cultural bets about how the organisation wants to work. Getting the ergonomic footprint of each desk right matters here too, since undersized workstations create hidden costs in comfort and productivity that don’t show up in a square-metre spreadsheet.
Turning the numbers into a fit-out: an implementation checklist
Once you’ve got a working figure, the gap between a spreadsheet and a signed lease is where most projects lose time. Work through these steps in order:
- Collect real utilisation data using badge swipes, sensors or booking system exports over a minimum four-week period, ideally across different seasons.
- Run a test-fit on the actual floor plate you’re considering, not a generic template; column placement, core location and window lines all eat into theoretical usable area.
- Confirm the load and loss factor directly with the landlord and architect rather than relying on a market-average assumption; this figure varies meaningfully between buildings.
- Budget for build costs realistically, including services relocation, and get quantity surveyor input before signing anything.
- Secure stakeholder sign-off on accessibility provisions, privacy requirements for sensitive roles, and IT/data infrastructure needs.
- Watch the classic cost drivers during procurement: AV equipment in meeting rooms, acoustic treatment for open-plan noise control, and HVAC capacity upgrades if density has increased.
- Set post-occupancy KPIs covering desk utilisation rates, meeting room booking patterns and staff satisfaction, then review at 90 days and again at 12 months.
Pro Tip: Budget acoustic treatment and AV as separate line items from the start, not as a contingency afterthought. They’re consistently the two categories that blow out fit-out budgets when they’re bundled into a general allowance instead of quoted properly.
The growth buffer you calculated earlier should get revisited at the 12-month review, because actual headcount growth rarely tracks the projection made during lease negotiation. Treating that buffer as a fixed assumption rather than a live number is how organisations end up needing a second fit-out inside three years.
How Niche Projects applies this planning method
Niche Projects has spent years turning exactly this calculation, benchmark, peak occupancy, communal allowance, load factor, into workable fit-outs for corporate offices, creative agencies and growing startups across the strategy-to-delivery pipeline. Adam leads much of this planning work, translating headcount data and role mixes into floor plates that actually get built.
The method in practice looks like this:
- Strategy phase: Establish role buckets, peak occupancy targets and cultural priorities before a single square metre gets discussed.
- Test-fit phase: Stress-test the calculated figures against a real floor plate, catching the column clashes and core placement issues that spreadsheets miss.
- Design phase: Apply role-based allocation principles to balance density against collaboration and wellbeing needs.
- Delivery phase: Manage construction and fit-out to the agreed plan, keeping load factor and growth buffer assumptions intact through to handover.
Clients moving through this process have reported measurable gains in space efficiency and staff satisfaction once role-based allocation replaced a flat per-person guess. If you’d rather have a practitioner run these numbers against your actual headcount and floor plate, Niche Projects offers a free office space plan to get you started.
Sources
- How much office space do you need? Free calculator (2026) | TenantBase
- Office Space Per Employee: Benchmarks and hybrid insights | Occuspace
- Compliance code: workplace facilities and the working environment | WorkSafe Victoria
- Part 3: Workplace Design