

Plan office density from peak-day attendance, not weekly averages, and set desk numbers against a real occupational density figure rather than a rule of thumb. Test that figure against a fully furnished floor plan before you sign off on it. Pair any increase in density with acoustic, ergonomic and circulation controls, and document the safety checks. The sections below cover the metrics, the maths, the layout rules and the compliance steps that make this work in practice.
TL;DR:
- Planning should focus on peak-day attendance, not weekly averages, to ensure sufficient desks and circulation for the busiest days.
- The Australian government’s benchmark for office density is 14 m² of usable area per work-point for floors of 500 m² or more, but local factors may require adjustments.
- Acoustics, ergonomics, and circulation controls must be designed together with density to maintain comfort, safety, and productivity at higher occupancy levels.
- Document all safety, layout, and ergonomic measures thoroughly to ensure compliance with occupational health standards and prepare for potential disputes.
Table of Contents
- What office density planning actually measures
- Benchmarks and Australian guidance to consider
- How to calculate your office density and desk ratio
- Design controls that make higher density work
- Health, safety and compliance checks before you change density
- A short process for implementing density changes
- Niche Projects: practical proof points and tools you can use
- Get your office density plan built properly
- Sources
- FAQ
What office density planning actually measures
Office density planning is the process of matching the number of people and desks to the amount of usable floor area, then checking that the result still works on the busiest day of the week, not the average one. Get this wrong and you either pay for empty desks or squeeze people into a floor that fails on comfort, noise and safety.
Four terms get mixed up constantly, so it’s worth separating them properly.
- Occupational density — usable floor area divided by the number of allocated work-points (m² per work-point). This is the headline efficiency metric used in the Australian Government’s 2025 Office Occupancy Report.
- Usable area — the floor area available for work-points and support space, excluding structural cores, lift lobbies and plant rooms.
- Fit-out density — how tightly furniture, partitions and circulation are packed within the usable area, which determines whether the occupational density figure is actually liveable.
- Desk-to-employee ratio — the number of desks divided by the number of employees assigned to them, expressed as something like 0.7:1 for a hybrid floor.
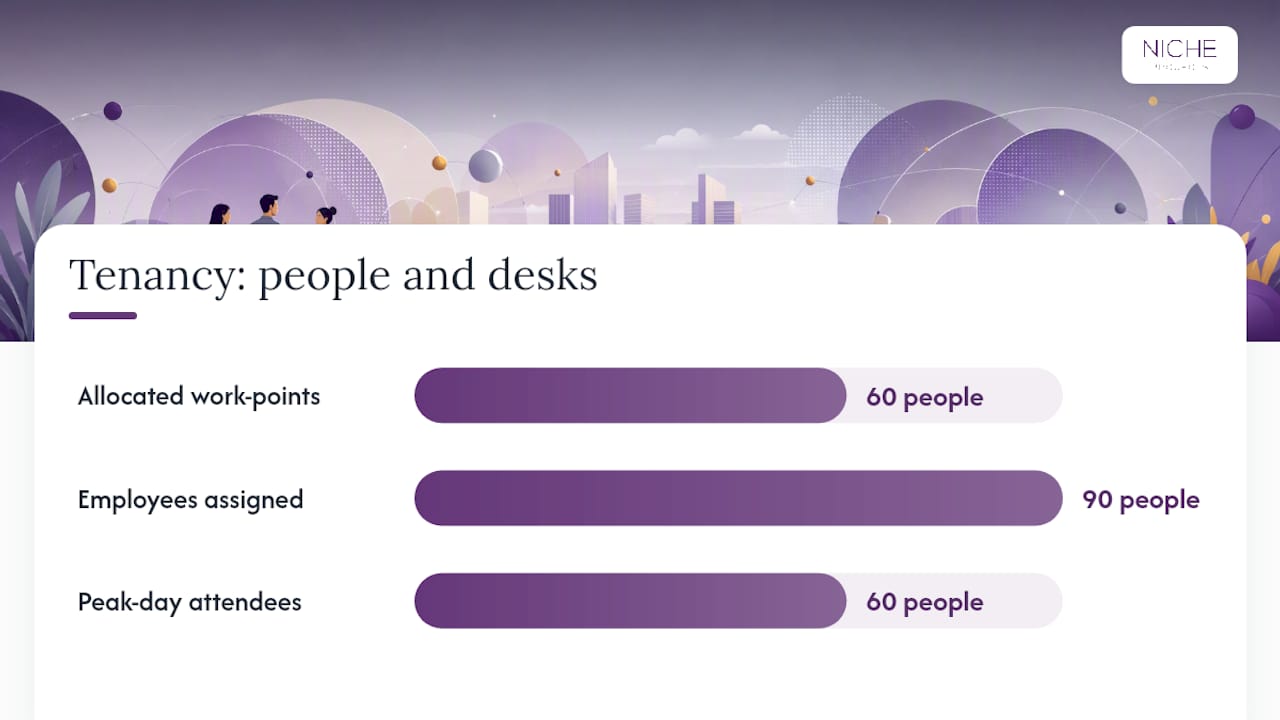
Here’s a worked example. A tenancy has 800 m² of usable area and 60 allocated work-points. Occupational density is 800 ÷ 60, or 13.3 m² per work-point. If the same floor employs 90 people but only 60 attend on the busiest day, the desk-to-employee ratio is 0.67:1 based on headcount, but the real test is whether 60 desks comfortably absorb that peak-day crowd.
This is where most density exercises go wrong. Teams average attendance across the week, get a comfortable-looking number, then discover on Tuesday and Wednesday that meeting rooms are booked out and desks run short. CBRE Australia’s research on hybrid attendance patterns found that averages consistently understate the demand on peak days, with unassigned seating growing as a workaround. Plan against the peak, and the average takes care of itself.
Benchmarks and Australian guidance to consider
The most useful national reference point is the Commonwealth’s 2025 Office Occupancy Report, which sets an occupational density target of 14 m² of usable area per allocated work-point for tenancies of 500 m² or more. That figure is a policy benchmark for government tenancies, not a universal legal ceiling, but it’s a sensible sanity check for any commercial office asking “are we too tight or too generous?”
The 14 m² benchmark: the Commonwealth target applies specifically to tenancies of 500 m² or larger. Smaller floors, high-collaboration teams and CBD locations with premium rents often sit outside this range for good reason, so treat it as a comparison point rather than a pass/fail test.
Planning-level guidance tells a slightly different story, because it’s built for approvals rather than portfolio efficiency. The 2023 CPAG workspace ratios published through the NSW planning portal suggest figures like 15 m² gross floor area per full-time employee for offices near transport hubs, with ranges adjusted for location and land use.
Use both references for what they’re good at:
- The Commonwealth’s 14 m² target for benchmarking your own occupational density against a national figure.
- CPAG ratios for local planning assumptions, particularly where a development application or transport-hub location is involved.
- Collaboration-heavy floors (agencies, product teams) generally sit looser than transaction-processing or call-centre floors, because meeting and breakout space eats into usable area differently.
- CBD towers with high rents often run tighter than suburban business parks, where land cost is less of a constraint.
One caveat worth stating plainly: Australian Standards referenced throughout workplace design, including acoustics and ergonomics standards, are design references, not automatic legal requirements. They become enforceable when incorporated into legislation, a lease, or a building contract. Treat them as the evidence you’d point to if someone asked how you exercised duty of care, not as a checklist mandated by default.
How to calculate your office density and desk ratio
Work through this in order, and don’t skip the peak-day step, because that’s where most density plans actually fail.
- Measure usable area. Pull the certified floor plan and strip out structural cores, lift lobbies, fire stairs and plant rooms. What’s left is your usable area for occupational density purposes.
- Map allocated work-points. Count every fixed desk, hot desk and dedicated workstation on the current or proposed plan, whether occupied or vacant.
- Calculate occupational density. Divide usable area by allocated work-points. A 900 m² floor with 70 work-points gives 12.9 m² per work-point, tighter than the Commonwealth’s 14 m² reference.
- Establish peak-day attendance. Pull badge-swipe or booking-system data for the last eight to twelve weeks and identify the actual highest-attendance day, not the average.
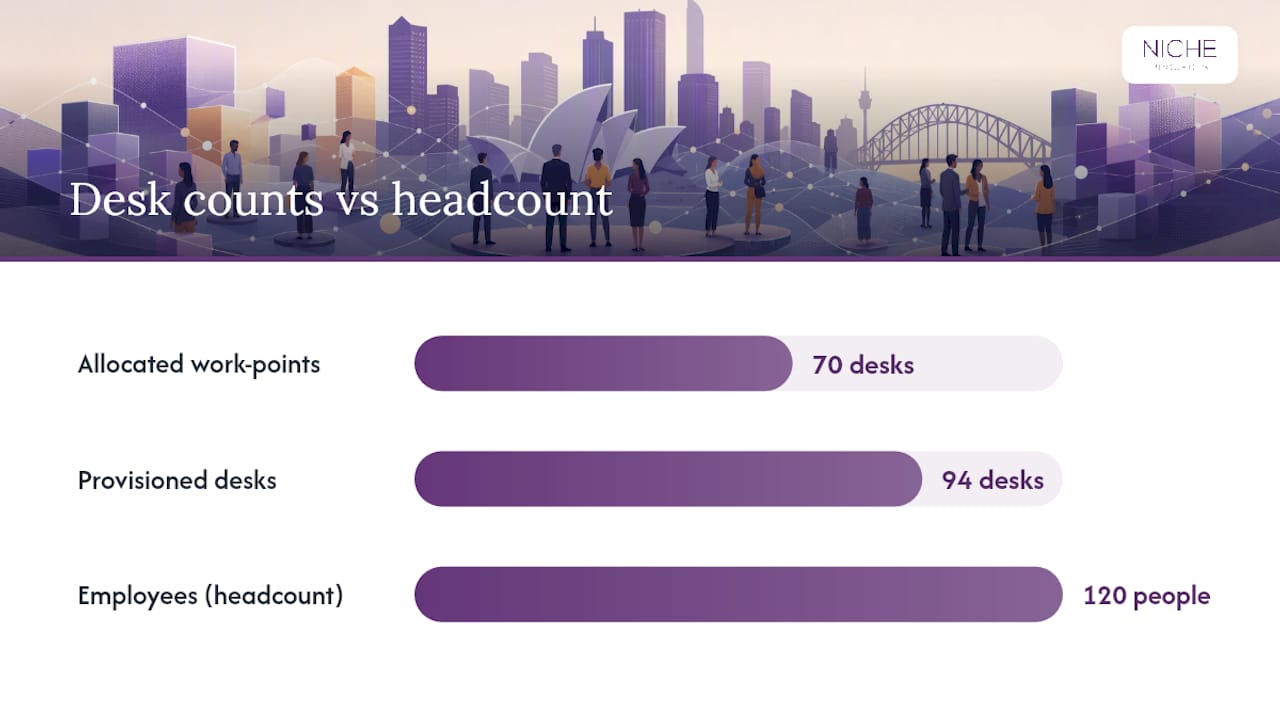
- Set the desk ratio against that peak. If peak attendance is eighty-five people against 120 employees, and you want a 10% buffer for growth and last-minute changes, provision for approximately ninety-four desks, a ratio near 0.78:1.
- Cross-check against meeting-room ratio, vacancy rate and cost-per-seat. A tight desk ratio paired with too few meeting rooms just moves the shortage from desks to bookable space.
That last step matters more than people expect. Butlr’s planning metrics guide lays out nine metrics, including utilisation rate, peak occupancy, meeting-room ratio, vacancy rate and cost-per-seat, and the real value comes from pairing two or three of them rather than relying on any single number. A desk ratio that looks efficient on paper can still fail if meeting-room utilisation is already at capacity, or if cost-per-seat calculations show you’re paying premium rent for space that sits empty three days a week.
Pro Tip: Pull badge-swipe data for a full school term, not just a fortnight. Attendance spikes around school holidays, EOFY and major project deadlines will otherwise skew your peak-day figure in either direction.
Design controls that make higher density work
Density only works when the controls around it are designed at the same time, not bolted on afterwards. Three areas do most of the heavy lifting: acoustics, ergonomics and circulation.
Acoustics. AS/NZS 2107:2016 sets recommended background sound levels and reverberation times for office interiors, and it’s the standard most acoustic consultants reference when a floor is getting denser. Tighter desk spacing raises ambient noise and reduces speech privacy unless you actively manage it.
- Sound masking systems to raise the ambient noise floor and reduce intelligible distance between desks.
- A deliberate mix of enclosed rooms, quiet zones and open collaboration space rather than one uniform open-plan layout.
- Acoustic treatments built into ceilings, partitions and soft furnishings at the design stage, not added as an afterthought.
Ergonomics and movement. Higher density often means less room per desk, which makes adjustability non-negotiable rather than a nice extra. Ergonomic furniture with height adjustment, proper monitor arm reach and accessible power at every seated position reduces the physical strain that comes with tighter layouts. Build in reasons to move, whether that’s a walk to a shared printer or a standing meeting zone, because static posture problems compound quickly on denser floors.
Circulation. This is the step most test-fits get wrong: they check the plan empty, then discover the problems once furniture, AV carts, bins and filing cabinets go in. Test your populated plan at full peak occupancy, and confirm walkway widths, emergency egress paths and service access before you finalise anything.
Health, safety and compliance checks before you change density
WorkSafe Victoria’s office guidance treats layout and density squarely as an occupational health and safety design question, not a real estate one. That framing matters because it shifts density from a cost exercise to a duty-of-care exercise, and the checks it recommends, walkways, partition placement, workstation design and posture, become your documented evidence of responsible decision-making.
Standards like AS/NZS 2107 and relevant National Construction Code provisions aren’t automatically enforceable on your floor. They become your reference evidence when someone asks how you arrived at a safe, comfortable density, which is exactly the situation you want to be in if a WHS complaint or lease dispute ever arises.
Before you change density on any floor, record the following:
- A written risk assessment covering walkways, egress paths, partition heights and workstation adjustability.
- Sign-off from HR, facilities and a WHS representative, not just the person managing the budget.
- Updated emergency evacuation plans reflecting the new headcount and desk layout.
- Ventilation and cleaning arrangements adjusted for the new occupancy level, particularly in shared zones.
- Confirmation that furniture and fit-out specifications meet the ergonomic minimums your organisation has committed to.
WorkSafe’s guide for employers also flags something easy to overlook: OHS practices need to keep pace with flexible and remote work patterns, so a density plan built for five-day attendance can go stale within a year if hybrid rosters shift.
A short process for implementing density changes
Run this as a phased project rather than a single decision, and involve facilities, HR and a WHS representative from the start.
- Audit the current state. Pull badge-swipe data, booking-system logs, current headcount and existing furniture plans.
- Set a target density. Use the Commonwealth’s 14 m² benchmark and relevant planning ratios as comparison points, adjusted for your team’s collaboration needs.
- Test with a populated plan. Furnish the plan fully and simulate peak-day attendance, checking circulation, egress and service access.
- Adjust policy settings. Booking rules, rostered in-office days and meeting-room allocation often solve a density problem faster than adding desks.
- Monitor and iterate. Re-check attendance data quarterly, because hybrid patterns shift faster than most fit-outs are designed to accommodate.
Pro Tip: Keep every populated plan version you test, even the rejected ones. When someone later asks why the floor is laid out a certain way, having the discarded alternatives on file is the fastest way to show your reasoning was sound.
Minimum documentation to retain: the final populated plan, written risk notes from the WHS sign-off, a baseline of your key metrics (occupancy, desk ratio, meeting-room utilisation) and a communications plan for the rollout. This becomes your governance record if the layout is ever questioned.
Niche Projects: practical proof points and tools you can use
If you’d rather not build all of this from scratch, a few practical resources shorten the process considerably. Nicheprojects’ Free Office Space Plan gives you a starting test-fit to work from during the audit phase, and the pre-design checklist covers the questions worth answering before a floor plan is finalised.
Beyond the templates, Nicheprojects works across the categories most density decisions touch:
- Workplace strategy for setting the target density and desk ratio in the first place.
- Office design for translating that target into acoustics, ergonomics and circulation that hold up under peak load.
- Fit-out and refurbishment for the construction side once the plan is signed off.
Get your office density plan built properly
Running the numbers yourself gets you a target. Turning that target into a floor that passes a peak-day stress test, meets WHS expectations and still feels good to work in is a different job entirely. Nicheprojects handles that end-to-end, from the initial workplace strategy work that sets your density target through to Sydney office design and the fit-out and refurbishment work that builds it.
For readers who want to run their own iterations first, tools like Spaceplanner offer quick AI-driven test-fit options worth exploring before you commit to a final layout. But once you’ve got a target density and a populated plan you’re confident in, the next practical step is getting it built by people who’ve delivered these projects before. An office space plan can help show what a current floor could look like at the density being targeted.
Sources
- Office health and safety — Office layout and design (WorkSafe Victoria)
- Australian Government — 2025 Office Occupancy Report
- 2023 CPAG workspace ratios — Planning portal NSW
- 9 office space planning metrics with calculators — Butlr
FAQ
What are the Australian standards for office space?
There’s no single mandatory Australian standard that sets office space per person. AS/NZS 2107:2016 covers acoustic design targets, while WorkSafe Victoria’s guidance treats layout and density as an OHS design matter rather than a fixed rulebook, and standards typically apply through legislation, leases or contracts rather than automatically.
How many square metres per person in an office?
The Commonwealth’s benchmark is 14 m² of usable area per allocated work-point for tenancies of 500 m² or more, though this is a policy target rather than a universal rule. Planning guidance like the 2023 CPAG ratios suggests figures like 15 m² gross floor area per employee near transport hubs, and the right figure for your office depends on location, collaboration needs and lease constraints.
What are the four principles of office layout?
Practical office layout comes down to circulation, acoustics, ergonomics and adjacency. Circulation covers walkway widths and egress, acoustics governs noise and privacy per AS/NZS 2107, ergonomics covers furniture and posture, and adjacency governs which teams and functions sit near each other and near meeting spaces.
How much office space do you need for 100 employees?
Start with peak-day attendance rather than headcount, since most hybrid offices only need desks for their busiest day, not every employee at once. Plan based on the Commonwealth’s 14 m² benchmark per allocated work-point, adjusted up or down based on your meeting-room ratio and buffer preferences.
What does Nicheprojects charge for office density planning?
Pricing for workplace strategy and office design work depends on the scope of the project, and current details are available directly through Nicheprojects’ workplace strategy page. Free resources like the Free Office Space Plan are available as a starting point before any paid engagement.